 (3)")
Written by Dr Shalen Sehgal | Crises Control
Every IT incident in 2026 carries higher operational cost than the same incident did three years ago. Customer expectations have tightened. Regulatory deadlines have shortened. Recovery windows have compressed. The teams that absorb this pressure best are the teams that stopped treating incident response as a sequence of manual handoffs and built it as an automated pipeline instead.
Automated IT incident response is the use of predefined workflows, real-time communication, escalation logic, and operational automation to detect, coordinate, manage, and resolve incidents faster and more consistently. Rather than depending on disconnected teams and manual handoffs, organisations can standardise response actions, improve visibility, and reduce the operational impact of critical incidents.
This guide explains how that pipeline works. It walks the full lifecycle from the moment a monitoring signal arrives to the moment the post-incident review closes, stage by stage, in operational language. It is written for the IT and Operations leaders responsible for getting incident response right under regulatory, commercial, and reputational pressure that none of their predecessors faced at this scale.
Automated IT Incident Response works as a six-stage pipeline. Signals are ingested from monitoring, ITSM, security, and external sources. Related signals are correlated into a single incident record with a defined severity. Named owners are paged across multiple channels with two-way confirmation. Pre-built playbooks trigger and assign tasks. Parallel workstreams handle recovery and stakeholder communication. Timestamped evidence feeds the post-incident review. Each stage handles work that the human team cannot do at the speed and consistency the incident requires.
Why this matters more in 2026 than it did in 2023
Three forces have raised the operational stakes of every IT incident.
Regulatory scope is widening. The UK Cyber Security and Resilience Bill reached Royal Assent in late 2026, bringing managed service providers and designated critical suppliers into formal regulatory scope. The Bill mandates a 24-hour early warning and a 72-hour full incident report to both the sector regulator and the National Cyber Security Centre. Financial services firms already operate under the FCA operational resilience framework. DORA applies across the EU and UK-linked financial entities. The evidence requirements behind these regimes do not survive a manual response.
Incident volume is rising. The UK NCSC recorded 204 nationally significant cyber incidents in the past 12 months, more than double the 89 reported the year before. 95% of UK critical national infrastructure organisations experienced a data breach in 2024. Teams that handled five major incidents a year five years ago are handling fifteen now. Manual response does not scale to that volume without breaking.
Boards are paying attention. Operational resilience now sits as a named risk category in board reporting frameworks across regulated sectors. Boards ask for evidence of execution, not evidence of plans. That shift makes the automated pipeline a board-level capability, not a technical preference.
An automated IT incident response pipeline is not a single feature. It is an operating discipline encoded in software, with named platform-human boundaries at every stage. Get the boundaries right, and the platform becomes the spine of the response. Get them wrong, and the platform becomes another source of noise.
The six stages of automated IT incident response
The pipeline covers six identifiable stages between the raw signal and the closed audit record. Each stage handles a different kind of work. Each stage has a different platform-human boundary. The summary below previews the full pipeline; the sections that follow walk each stage in depth.
|
# |
Stage |
What the platform does |
What the human still does |
|
1 |
Alert ingestion |
Receives signals via webhook, API, email, syslog, polling |
Defines which signal sources are authoritative |
|
2 |
Correlation and classification |
Groups related signals, classifies severity, raises incident record |
Approves severity escalation above defined thresholds |
|
3 |
Notification and mobilisation |
Pages named owners across multiple channels with confirmation |
Acknowledges, declares incident, joins bridge |
|
4 |
Workflow execution |
Triggers playbooks, assigns tasks, tracks status |
Performs diagnosis, executes fixes, makes judgement calls |
|
5 |
Recovery and stakeholder communication |
Drafts comms by tier, tracks workstreams, captures audit trail |
Approves communications, validates recovery, declares closure |
|
6 |
Post-incident review |
Exports timeline, generates reports, surfaces patterns |
Analyses root cause, updates playbooks, owns improvements |
STAGE 1 OF 6
Alert ingestion
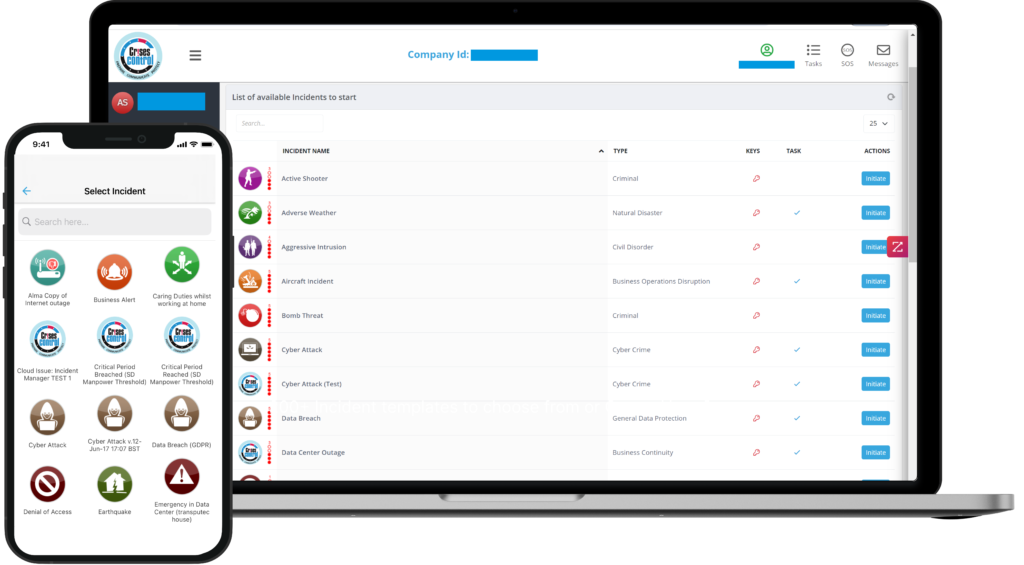
Every incident pipeline starts with a signal. The signal might be a CPU threshold breach from Datadog, a synthetic monitoring failure from New Relic, a ServiceNow major incident ticket raised by the service desk, a SIEM security alert, a vendor status page change, or an inbound email from a customer technical contact. The first task is to receive all of these without manual intervention and convert them into a common internal format.
WHAT HAPPENS The platform exposes ingestion endpoints for each signal type. Webhooks accept HTTP POST payloads from monitoring tools and ITSM systems. REST APIs accept structured calls from custom integrations. Email-to-incident parsing handles systems without webhook capability. Syslog and SNMP cover legacy infrastructure. Polling connectors pull signals from systems with no push capability. Each path normalises the payload so the downstream stages can process signals from any source uniformly.
PLATFORM VS HUMAN Platform: receives and normalises signals regardless of source. Human: defines the authoritative signal sources during configuration, decides what enters the pipeline, and decides what stays out. Informational alerts and low-severity noise should not enter the pipeline at all.
Without automation, operators reconcile signals manually across multiple dashboards. The 03:00 alert lands in five systems, and the on-call engineer hears about it from whichever one they happen to check first. The time between the signal landing and a human acknowledging it stretches from seconds to twenty minutes. The audit trail begins with a manual log entry that arrives forty minutes after the underlying event, which means later regulatory reports cannot evidence the early stages of the response.
Ingestion is the easiest stage to underestimate during procurement and the most consequential to get right. A pipeline that cannot accept signals from a particular monitoring tool, ITSM platform, or security stack cannot run an automated response for that system. Ingestion compatibility belongs in the first vendor demo, not the third.
STAGE 2 OF 6
Correlation and classification
A raw signal is not yet an incident. It might be a false positive. It might be one of several related signals from the same root cause that should be treated as a single event. It might be a low-severity warning that does not warrant mobilisation. The correlation and classification stage converts ingested signals into actionable incident records with a defined severity.
WHAT HAPPENS The platform applies correlation rules to group related signals. Logic operates on shared metadata: same affected service, same time window, same error signature, same client tenant where multi-tenancy applies. Classification rules then apply severity thresholds aligned to the organisation’s matrix and to ITIL 4 vocabulary: P1 if a critical business service is affected, P2 if a named department is affected, P3 if individual users are affected. Suppression rules filter known noise patterns and acknowledged maintenance windows.
PLATFORM VS HUMAN Platform: groups, classifies, and suppresses signals using rules the team defined upfront. Human: approves severity escalation when an incident crosses a defined threshold, tunes correlation rules at the post-incident review, and adjusts suppression patterns when new noise sources emerge.
WITHOUT AUTOMATION Five separate signals from a single root cause are handled as five separate incidents by five different engineers. The fault is live for two hours before someone in the NOC notices the pattern. By that point, each engineer has already started parallel diagnostics on their own version of the problem. False positives flood the on-call rota until acknowledgement fatigue sets in, at which point genuine alerts are dismissed alongside the noise.
Acknowledgement fatigue is measurable. Teams responding to more than 50 alerts per shift acknowledge genuine P1 incidents 30 to 60 seconds slower than teams responding to fewer than 20. Correlation and suppression discipline reduces total alert volume by 60 to 80% in mature deployments. (Industry incident response benchmarks 2023-2025)
STAGE 3 OF 6
Notification and mobilisation
Once an incident is classified, the response team must be mobilised. This is where most legacy approaches fail visibly. The email alert arrives in a shared inbox at 03:00 on a Sunday. The on-call engineer is between two other systems with the phone face-down. Forty-five minutes later, when the engineer next checks email, the incident has expanded across three other systems. The pipeline must reach named owners reliably and verifiably, regardless of time, location, or device state.
WHAT HAPPENS The Crises Control mass notification system delivers alerts across SMS, voice, email, push notification, native mobile app, Microsoft Teams, and Slack in parallel rather than serially. Two-way confirmation captures acknowledgement from the recipient and writes it back to the incident record. If the primary owner does not acknowledge within a defined window, typically 90 to 180 seconds, the alert escalates automatically to the named deputy. Critical-alert frameworks on iOS and Android break through Do Not Disturb mode. Shift-aware routing integrates with the organisation’s HRIS or on-call calendar, so the alert reaches the engineer actually on call at that hour.
PLATFORM VS HUMAN Platform: delivers the alert reliably, captures acknowledgement, escalates automatically when the window expires, and logs every action. Human: acknowledges the alert, declares the incident on the bridge call if escalation to major incident management is warranted, and begins the diagnostic conversation.
WITHOUT AUTOMATION The audit trail shows the alert was sent. It does not show that anyone received it. The deputy was never paged because the platform had no mechanism to detect a missed acknowledgement from the primary. The bridge call starts forty minutes late because the Major Incident Manager only saw the email at 03:45. The customer-facing service is down for an hour longer than it would have been with automated mobilisation, and the operational SLA is breached before the technical team has even joined the call.
Email-only notification was sufficient in 2015. In 2026, with the regulatory and operational pressure most enterprises operate under, email-only notification is operationally negligent. Multi-channel parallel delivery with two-way confirmation is the modern baseline.
STAGE 4 OF 6
Workflow execution
Once the response team is mobilised, the work itself begins. Diagnostics. Containment. Workarounds. Fixes. Verification. Without automation, this work is coordinated through bridge calls, group chats, email chains, and the Major Incident Manager’s running notes. With automation, the workflow runs on rails the team built and tested in advance.
WHAT HAPPENS The Crises Control Incident Manager triggers a pre-built playbook matched to the incident classification. The playbook defines named tasks, named owners, dependency logic, and timing windows. As the response progresses, the platform tracks task completion in real time. Blocked tasks surface visibly. Completed tasks update downstream tasks automatically. Leadership sees a single consolidated dashboard rather than five fragmented updates. Playbooks are versioned so the team can iterate them after each post-incident review without losing the history of past responses.
PLATFORM VS HUMAN Platform: orchestrates the workflow, assigns tasks, tracks status, surfaces blockers, and captures every action against the audit trail. Human: performs the actual diagnostic and recovery work, makes judgement calls the playbook cannot anticipate, and adjusts the playbook in flight if the incident takes an unexpected turn.
WITHOUT AUTOMATION The response runs in group chat. The L2 engineer escalates verbally, then via chat, then via email. The Major Incident Manager forwards decisions to the account director, who forwards them to the client. Three workstreams run in parallel with no visibility between them. At 14:00, four hours into the incident, nobody knows which actions have been completed, which are blocked, and which were never started. The post-incident review is reconstructed from memory and screenshots two weeks later.
The boundary at this stage is critical. The platform automates the orchestration of the workflow. It does not automate the diagnostic work itself, which remains the engineer’s domain. Platforms that try to automate diagnosis, typically marketed as AI-led autonomous response, generate false confidence and operational fragility. Platforms that orchestrate the workflow without replacing the engineer generate genuine speed.
STAGE 5 OF 6
Recovery and stakeholder communication
Recovery is where most incident pipelines collapse, because the workload spikes. The technical team is recovering the service. Customer service is fielding inbound complaints. Communications is drafting public statements. Legal is reviewing notification obligations. Finance is assessing the impact. The executive team is asking for updates. All of this happens in parallel, in real time, with commercial consequences on the wrong end of any miscommunication.
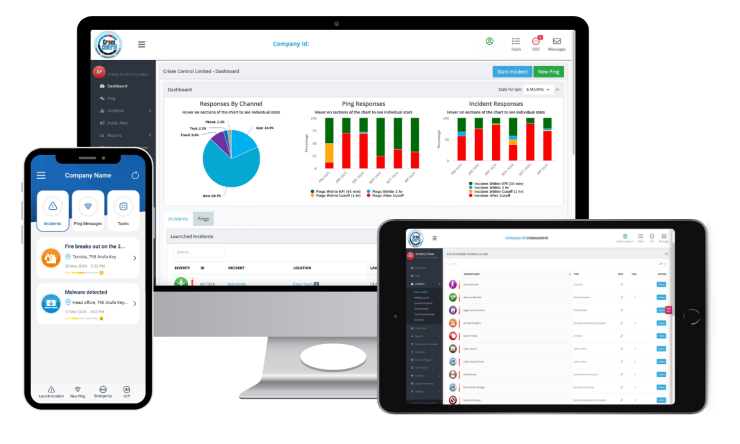
WHAT HAPPENS The Crises Control Task Manager runs parallel workstreams from the single major incident record. Each stakeholder group has its own communication cadence, channel, and template, all drawn from the live record so updates stay consistent. Customer communications by SLA tier draft automatically; the communications coordinator approves rather than writes from scratch. Internal stakeholder updates fire on schedule rather than on memory. Status page updates publish from the same source as the customer email, so the two never contradict each other. Every outbound message is captured against the audit trail with timestamp, channel, recipient, and acknowledgement status.
PLATFORM VS HUMAN Platform: drafts, delivers, and audits communications across audience tiers in parallel. Human: approves the substance and tone of customer-facing messages, validates that recovery is complete before declaring closure, and makes the executive and board-level calls that require named accountability.
WITHOUT AUTOMATION The customer service team sends one set of updates. The communications team sends a contradictory one. The status page says one thing; the customer email says another. The regulator receives a 72-hour report that contradicts the customer-facing timeline because the two narratives were drafted by different teams from different recollections of the same incident. Six weeks later, the regulator asks why, and nobody can produce an authoritative version.
Stakeholder communication is where 60 to 70% of incident response cost lives in regulated industries. Automation at this stage cuts that cost by half while improving consistency across audiences. (Crises Control deployment data, 2024-2026)
STAGE 6 OF 6
Post-incident review
The post-incident review is where the pipeline closes the loop. Without a structured review, every future incident starts from the same baseline as every past one. With a structured review, each incident becomes input to the next playbook iteration, the next correlation rule update, the next training scenario. Automation at this stage decides whether the review improves the team or consumes an afternoon of senior engineering time and changes nothing.
WHAT HAPPENS The Crises Control audit and reporting module exports the full incident timeline on demand: every signal ingested, every correlation match, every notification sent, every acknowledgement received, every task completed, every communication delivered, every recovery action, every closure decision. Timestamped to the second. Exportable in PDF for stakeholder distribution, CSV for analytical review, JSON for ingestion into other systems, and regulator-format templates for compliance submissions. Pattern detection surfaces repeat causes, frequently-blocked tasks, slow-to-acknowledge owners, and playbook gaps.
PLATFORM VS HUMAN Platform: surfaces the evidence and the patterns. Human: interprets the evidence, identifies root cause, decides which playbooks to update, owns the improvement actions, and presents findings to the review board. The judgement work remains human. The evidence work is automated.
WITHOUT AUTOMATION The post-incident review consumes two senior engineers for a full day reconstructing the timeline from email, chat, screenshots, and ITSM ticket history. The reconstruction is incomplete with visible gaps. Pattern detection across past incidents depends on the engineer’s memory of what happened last time, which fades. Playbook updates lag the incidents that should have driven them by months. The next P1 with the same root cause runs the same length as the last one.
Audit trail capture was designed around a single principle: post-incident review evidence should be a by-product of running the incident, not a separate workstream afterwards. Captured continuously through stages 1 to 5, exported in whatever format the review board, the auditor, or the regulator requires. Aligned to ISO 22301 clause 8.4.2 incident response procedures and ISO 27001 Annex A.5.24 information security incident management.
If the current post-incident review workflow consumes two senior engineers for a day per incident, the operational cost of manual review has already exceeded the platform cost of automation. Book a demo of the platform.
Interested in our Incident Management Software?
Flexible Incident Management Software to keep you connected and in control.
How the six stages fit together in a real incident
The stages are presented sequentially because that is how they unfold in time, but in practice they overlap. Stages 1 to 3 typically run inside the first three minutes. Stage 4 begins within five minutes and continues until the technical fix is in place. Stage 5 begins as soon as customer impact is confirmed and runs through closure. Stage 6 begins immediately at closure and continues over the following days as the review board completes its work.
Automated pipeline: 30 minutes end to end
Minute 0: monitoring tool detects a threshold breach and posts to the platform’s webhook. Five seconds later, a correlation rule matches two other recent alerts from the same affected service, and a P2 incident record is raised. Ten seconds in, alerts dispatch to the named on-call engineer across SMS, voice, email, and push notification with two-way confirmation.
Minute 1: the engineer acknowledges; alert escalation is cancelled. Minute 2: the engineer joins the bridge call, where the playbook for the affected service has already opened. Minute 5: customer impact confirmed; the platform escalates to P1 and notifies the communications team. Minute 8: the customer status page updates automatically from the incident record. Minute 12: the customer email drafts from a template, is approved by the communications coordinator, and is delivered. Minute 25: the technical fix is implemented and recovery validated. Minute 28: the communications coordinator publishes the recovery message. Minute 30: the incident closes; the full timeline exports for the next morning’s review.
Manual response: four hours end to end, plus a day of reconstruction
Minute 0: the monitoring tool sends an email to the operations distribution list. Minute 8: somebody checks email and notices the alert. Minute 14: an engineer opens a chat group. Minute 22: the deputy is reached after the primary did not respond. Minute 35: the bridge call starts after the fifth attempt to schedule it. Minute 50: customer impact is noticed when a complaint arrives via the service desk. Minute 75: communications becomes aware. Minute 95: the first customer message goes out, contradicting the status page set independently by the technical team. Minute 240: technical recovery completes. The next morning, two senior engineers spend the day reconstructing the timeline. Three weeks later, the customer’s procurement team asks for the incident report, and the answer takes a week to produce.
The difference between a 30-minute automated pipeline and a 240-minute manual response is not the technology. It is the operational discipline encoded in the pipeline. The platform is the means; the discipline is the value.
Three deployment patterns at the platform-human boundary
Three patterns recur across mature deployments. Recognising which pattern fits the organisation’s risk appetite and operational maturity helps frame the procurement conversation realistically.
Pattern 1: full pipeline automation with human approval at decision points
All six stages run automatically. Humans approve at named decision points: severity escalation above P2, customer-facing communications, recovery validation, and incident closure. This is the most common pattern in mature deployments and the recommended starting point for most organisations. It captures most of the automation benefit while preserving named accountability at the decisions that require judgement.
Pattern 2: partial automation with human-led workflow execution
Stages 1 to 3 run automatically. Stage 4 is human-led, with the platform providing visibility but not orchestration. Stage 5 communications are human-drafted, with the platform handling delivery. Stage 6 audit trail is captured automatically. This pattern fits organisations in the early phase of automation maturity, where playbook discipline is still being built. It is a transitional pattern. Most organisations move to pattern 1 within twelve months.
Pattern 3: full pipeline automation with AI-assisted diagnosis
All six stages run automatically, with stage 4 enhanced by AI-assisted diagnostic suggestions surfaced to the responding engineer. The engineer remains the decision-maker; the AI surfaces possible root causes from past incident patterns. This pattern is emerging across mature deployments in 2026. It works when AI assistance is positioned correctly: as an evidence-surfacing tool, not an autonomous decision-maker. Platforms that position AI as the latter generate false confidence and operational fragility.
CRAiG, the Crises Resolution AI Guide inside Crises Control is positioned in pattern 3 specifically. It assists responders with structured guidance during live incidents without making autonomous decisions on incident classification, communications, or closure. The boundary is deliberate. AI should accelerate human judgement, not replace it.
Six characteristics of a mature automated IT incident response pipeline
Mature pipelines share six observable characteristics. None require the platform to be the only investment in incident response capability. All require the pipeline discipline to be operationalised through the platform.
First, signals from every authoritative monitoring, ITSM, and security source ingest into the platform automatically. No engineer reconciles signals across dashboards. No alert lives only in a shared inbox.
Second, related signals correlate into single incident records. Severity classifications apply automatically. False-positive suppression patterns are tuned continuously. Acknowledgement fatigue is measurably absent.
Third, notification reaches named owners across multiple channels with two-way confirmation. The on-call engineer’s mobile messaging app is no longer the single point of failure. The platform knows who acknowledged and who did not, and escalates accordingly.
Fourth, playbooks trigger automatically with named owners on each task. The Major Incident Manager runs the bridge call against a live workflow dashboard rather than a running notes document. Leadership sees one consolidated view.
Fifth, parallel stakeholder communications draft from templates, approved by humans, delivered consistently across audiences. The status page, customer email, internal update, and regulator notification all draw from the same source incident record.
Sixth, the post-incident review consumes hours not days. The timeline exports on demand. Pattern detection surfaces improvement opportunities the team would otherwise miss. Playbook updates ship within days of the review, not months.
Final thoughts
The senior leaders evaluating automated IT incident response in 2026 are not making a tooling decision. They are making an operational discipline decision that will be visible in board reporting, regulatory submissions, and customer trust metrics for the next three to five years.
Manual incident response served the previous generation of IT operations because the operational, regulatory, and reputational stakes were lower. Those stakes have moved. Boards now expect evidence of execution, not evidence of plans. Regulators expect timestamped audit trails inside 24 and 72 hour windows, not retrospective reconstructions. Customers expect transparent status communication that does not contradict itself between channels. None of these expectations survive a manual response.
The pipeline described in this guide is not theoretical. It is the architecture mature regulated-industry deployments are running in 2026, with measurable improvements in detection-to-action time, customer communication consistency, regulatory report timeliness, and post-incident learning. The most consequential procurement question is not which platform sends alerts fastest. It is which platform encodes the operational discipline the organisation needs at each of the six stages.
Crises Control is built around this six-stage pipeline. The platform itself holds ISO 22301 and ISO 27001 accreditation, which means the audit-trail discipline is engineered into the product rather than configured on top. Pre-built playbooks ship with the platform. Native integrations with ServiceNow, Jira Service Management, Halo, Microsoft Teams, Slack, and the major monitoring stacks are standard. Multi-channel mass notification with two-way confirmation reaches named owners reliably at 03:00 on a Sunday. Regulator-format report templates draw from the live audit trail, including the 24-hour and 72-hour reports required by the upcoming UK Cyber Security and Resilience Bill.
Translating that into a deployed capability does not require a transformation programme. It requires the right pipeline, configured against the organisation’s actual operational reality, with clear platform-human boundaries at every stage. The next step is a structured demo against the six stages of your own current process, scoring where automation enters today and where it should enter next.
Score your current incident response against the six stages. Identify where automation should enter, where it should stop, and where the platform-human boundary needs to be redrawn. Request a Crises Control demo.
FAQs
1. How does automated IT incident response work?
Automated IT incident response works as a six-stage pipeline: alert ingestion (signals enter from monitoring, ITSM, security, and external sources), correlation and classification (related signals group into a single incident record with severity classification), notification and mobilisation (named owners are paged across multiple channels with two-way confirmation), workflow execution (pre-built playbooks trigger and assign tasks), recovery and stakeholder communication (parallel workstreams run with audit trail capture), and post-incident review (timestamped evidence is analysed and fed back into improved playbooks). Each stage has a defined platform-human boundary.
2. What is the first stage of automated IT incident response?
Alert ingestion is the first stage. The platform accepts signals from monitoring tools, ITSM platforms, security tools, and external sources via webhook, REST API, email, syslog, and polling. Each signal is normalised into a standard internal format so downstream stages can process signals from any source uniformly. Ingestion compatibility with the organisation’s existing tool stack is the single most important capability to verify during procurement.
3. What is the difference between automated IT incident response and SOAR?
SOAR (Security Orchestration, Automation, and Response) focuses on security incident response automation, with playbooks triggered from SIEM and EDR signals to execute predefined security actions. Automated IT incident response covers a broader category: the full IT incident lifecycle from monitoring alerts through ITSM tickets through major incident management to regulatory reporting. SOAR is typically a component of a mature automated IT incident response architecture, not a replacement for it. The two integrate through webhooks.
4. How long does it take to deploy automated IT incident response?
Typical deployment runs from four to twelve weeks. Stages 1 to 3 (ingestion, correlation, notification) deploy in weeks one to four. Stage 4 (workflow execution) deploys in weeks four to eight, with playbook design as the primary effort. Stages 5 and 6 (communication automation and review templates) deploy in weeks six to twelve. Variability is driven by integration complexity and playbook maturity, not by the underlying technology. Organisations with strong existing runbooks deploy faster.
5. Which stages should be automated and which should not?
Stages 1 to 3 should be fully automated in every deployment. Stage 4 should be platform-orchestrated with humans performing the diagnostic and recovery work. Stage 5 should be platform-drafted and human-approved. Stage 6 should be platform-evidenced and human-interpreted. The decisions that should remain explicitly human are: severity escalation above defined thresholds, customer-facing communication approval, recovery validation, and incident closure declaration. Automating these specific decisions creates false confidence and operational fragility.